Three-Dimensional Site Response Analysis of Sloping Ground
Example prepared by: Christopher McGann and Pedro Arduino, University of Washington
Return to OpenSees Examples Page
This article discusses a three-dimensional effective stress site response analysis of a slope using OpenSees. The considered site consists of layered cohesionless soil underlain by bedrock. The slope has a 2% grade perpendicular to the direction of shaking. The model consists of a single column of 3D brick elements supported vertically at the base. Periodic boundary conditions are applied in both horizontal directions. A Lysmer-Kuhlemeyer (1969) dashpot is utilized to account for the finite rigidity of the underlying elastic medium, and the loading is applied in a manner consistent with that proposed by Joyner and Chen (1975).
Provided with this article are several files. Files which are required for the analysis are indicated. The files include:
- The example input file, freeField3D.tcl (required for analysis)
- The velocity time history of the selected earthquake record, yerbaNSvelocity.out (required for analysis)
- A GiD post-process mesh file, freeField3D.flavia.msh (generated automatically by running freeField3D.tcl)
- A Matlab script, flaviaWriter.m, which can be used to reformat the recorded output from OpenSees into a file which can be read by GiD for post-process visulization. Non-Matlab users may find the process represented by this file useful in creating an alternative means for accomplishing this reformatting.
- The post-process results file, freeField3D.flavia.res, which is generated through the use of the flaviaWriter.m script. This file, combined with the file freeField3D.flavia.msh, allows the user to visualize the results of the site response analysis using GiD.
All of the files mentioned above can be downloaded here.
To run this example, the user must download the input file, freeField3D.tcl, and the velocity time history file, yerbaNSvelocity.out, and place them in a single directory. The additional files described above are not essential to the analysis. They are provided to demonstrate how to use the GiD tool to visualize results from this type of analysis.
For further information into a site response analysis using OpenSees, the user is referred to the 2D total stress site response analysis example, the 2D effective stress site response analysis example, and the set of examples developed at UCSD available here.
Model Description

The site response analysis discussed in this article is for a soil profile consisting of a 10 m thick layer of loose sand (Dr = 40%) above a 20 m thick layer of more dense sand (Dr = 75%). The profile is assumed to be on an infinite slope with a 2% grade. The soil profile is the same as that described in the 2D effective stress site response example The entire soil profile is underlain by an elastic half-space which represents the finite rigidity of an underlying bedrock layer. The groundwater table is located at a depth of 2 m. Earthquake excitation is applied in the direction perpendicular to the slope.
Mesh Geometry
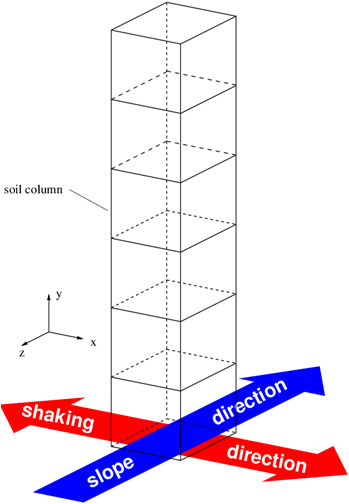
The input file freeField3D.tcl is set-up in a manner such that the user need only define the geometry of the soil layers and groundwater table along with the number of elements (vertically) within each layer. Note: if the ground water table is not located at the surface, an additional soil layer must be included to differentiate the dry or moist soil above the gwt from the saturated soil below the gwt. The default values are for 0.5 m high elements. A single column of 8-node brick elements is created based off of the input information. The vertical direction for this column is oriented with the global y-direction, and the elements are sized equally in the global x- and z-directions. The shaking is applied in the x-direction and the slope is in the z-direction. A schematic representation of the model is shown in Fig. 1.
Boundary Conditions
The column of elements is supported vertically at the base. Periodic boundary conditions are applied in the global x- and z-directions using the equalDOF command. Dashpots are applied at the base of the column in the global x- and z-directions to simulate the underlying bedrock layer after Lysmer and Kuhlemeyer (1969). The viscous uniaxial material is used with zeroLength elements to define the dashpots. Following the method of Joyner and Chen (1975), the dashpot coefficients are defined as the product of the mass density and shear wave velocity of the underlying bedrock. Above the groundwater table, the pore pressure degrees-of-freedom are fixed to allow drainage. The pore pressure degrees-of-freedom for all nodes below the groundwater table are left free to indicate saturated undrained conditions.
Material and Element Definitions
The soil constitutive behavior is modeled using the PressureDependMultiYield02 nDMaterial object. The default material parameters are based upon the recommended table of parameters available on the PressureDependMultiYield02 page for the appropriate relative densities.
Note: The mass density input values for the material objects should be total mass densities, i.e. above the groundwater table, the mass density should reflect dry or moist conditions, and below the groundwater table, the mass density should be the saturated value.
Included with the material definitions for each soil layer are additional parameters which are used by the elements. These include the fluid bulk modulus, the voids ratio, the body forces, and the x-, y-, and z-direction permeabilities. For effective stress analysis, the body forces should be the components of gravity. Note the difference to total stress analysis, where body forces are typically the components of the material unit weight. The slope in this example is simulated as a static shear stress generated by applying gravity with components in the the y- and z-directions.
The SSPbrickUP element is used in this example. This element uses a u-p formulation to consider the coupling between the solid and fluid phases of the soil mixture. The SSPbrickUP element uses stabilized single-point integration for the solid phase, and includes direction stabilization of the fluid phase in the incompressible-impermeable limit via a stabilization parameter. This element provides a computationally-efficient alternative to a higher-order 3D u-p element such as the 20_8_BrickUP Element.
Loading and Analysis
The analysis is split in to two phases, (1) an initial gravitational phase and (2) a dynamic excitation phase. Separate recorders are generated for each phase. The gravitational analysis phase serves the purpose of developing the initial state of stress for the soil column, including the static shear stress representing the infinite slope. In the second phase of the analysis, an earthquake ground motion is applied to the base of the soil column in a manner consistent with that proposed by Joyner and Chen (1975). The motion is applied in the horizontal direction perpendicular to the slope (x-direction).
During the gravitational analysis, the permeability in each direction is set at 1.0 m/s to facilitate development of hydrostatic conditions. After completion of this analysis phase, the permeabilities are updated to their input values using the setParameter command.
Results

Several sets of results are presents to demonstrate the types of results which can be obtained from this type of analysis in OpenSees and to allow the user to confirm proper download and implementation of the example input files. Post-processing for the included plots was accomplished using Matlab and GiD. Refer to the following section of this article for further information on post-processing with GiD.
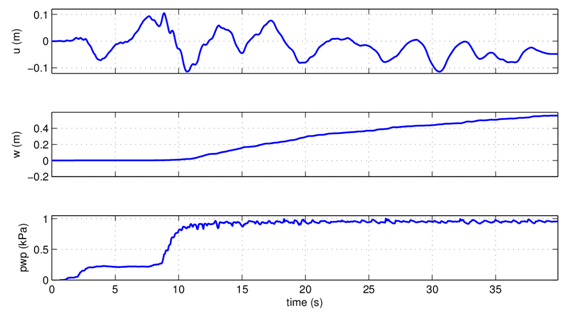
Fig. 2 shows the displacement at the top of the soil column (ground surface) in the direction of shaking and the direction of the slope along with the pore pressure ratio in the middle of the liquefiable soil. The slope is initially stable, then loses stability and begins move in the down-slope direction. As shown in Fig. 2, this loss of stability is due to liquefaction in the saturated loose sand layer.
GiD Visualization
Several files have been included in this article for the purpose of visualizing results in the pre- and post-processing tool GiD. The files related to this purpose are available for download here. The files are:
- freeField3D.flavia.msh
- freeField3D.flavia.res
- flaviaWriter.m
The file freeField3D.flavia.msh contains a list of the nodes and elements used in the analysis in a format that GiD understands. This file is automatically created by running the example freeField3D.tcl in OpenSees. The file freeField3D.flavia.res contains the data recorded during the analysis by the OpenSees recorders in a format that GiD can read. The Matlab script, flaviaWriter.m, converts the data recorded by OpenSees into this format. Further information on the formats for the *.flavia.msh and *.flavia.res files can be found in the GiD customization manual available here.
To visualize the results in GiD, the user should take the following steps:
- download and install copy of GiD
- save a blank project with the name freeField3D.gid
- place the files freeField3D.flavia.msh and freeField3D.flavia.res into the freeField3D.gid directory
- with this project open, select the Postprocess option in the 'files' menu
The program will then load the post-processing data contained in freeField3D.flavia.msh and freeField3D.flavia.res.
References
- Joyner, W.B. and Chen A.T.F. (1975) "Calculation of nonlinear ground response in earthquakes," Bulletin of the Seismological Society of America, 65(5), 1315-1336.
- Kramer, S.L. (1996). Geotechnical Earthquake Engineering. Prentice Hall, Upper Saddle River, NJ.
- Lysmer, J. and Kuhlemeyer, A.M. (1969). "Finite dynamic model for infinite media," Journal of the Engineering Mechanics Division, ASCE, 95, 859-877.