PressureDependMultiYield-Example 1
- Command_Manual
- Tcl Commands
- Modeling_Commands
- model
- uniaxialMaterial
- ndMaterial
- frictionModel
- section
- geometricTransf
- element
- node
- sp commands
- mp commands
- timeSeries
- pattern
- mass
- block commands
- region
- rayleigh
- Analysis Commands
- Output Commands
- Misc Commands
- DataBase Commands
Input File
clear all;

a1=load('acce.out');
d1=load('disp.out');
s1=load('stress1.out');
e1=load('strain1.out');
s5=load('stress3.out');
e5=load('strain3.out');

fs=[0.5, 0.2, 4, 6];
accMul = 9.81;

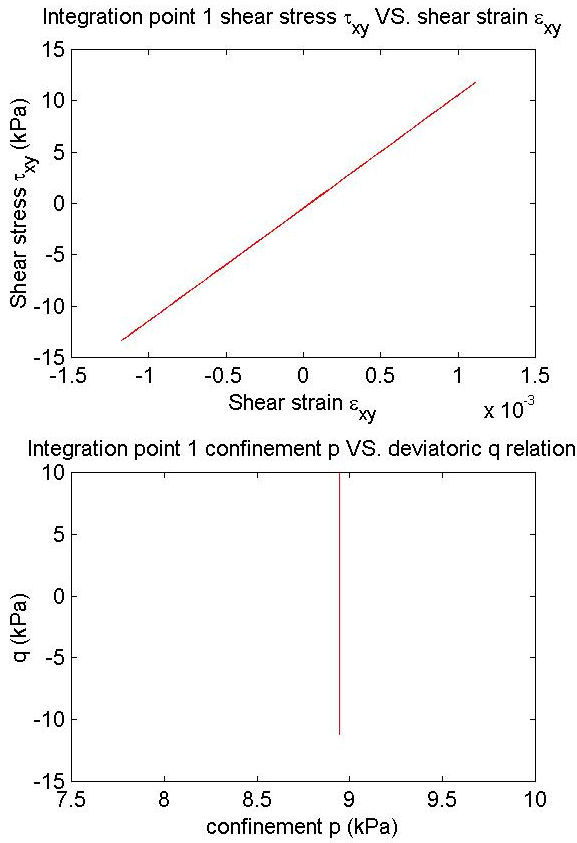
%integration point 1 p-q
po=(s1(:,2)+s1(:,3)+s1(:,4))/3;
for i=1:size(s1,1)
    qo(i)=(s1(i,2)-s1(i,3))^2 + (s1(i,3)-s1(i,4))^2 +(s1(i,2)-s1(i,4))^2 + 6.0* s1(i,5)^2;
    qo(i)=sign(s1(i,5))*1/3.0*qo(i)^0.5;
end
figure(1); clf;
%integration point 1 stress-strain
subplot(2,1,1), plot(e1(:,4),s1(:,5),'r');
title ('Integration point 1 shear stress \tau_x_y VS. shear strain \epsilon_x_y');
xLabel('Shear strain \epsilon_x_y');
yLabel('Shear stress \tau_x_y (kPa)');

subplot(2,1,2), plot(-po,qo,'r');
title ('Integration point 1 confinement p VS. deviatoric q relation');
xLabel('confinement p (kPa)');
yLabel('q (kPa)');
set(gcf,'paperposition',fs);
saveas(gcf,'SS_PQ1','jpg');

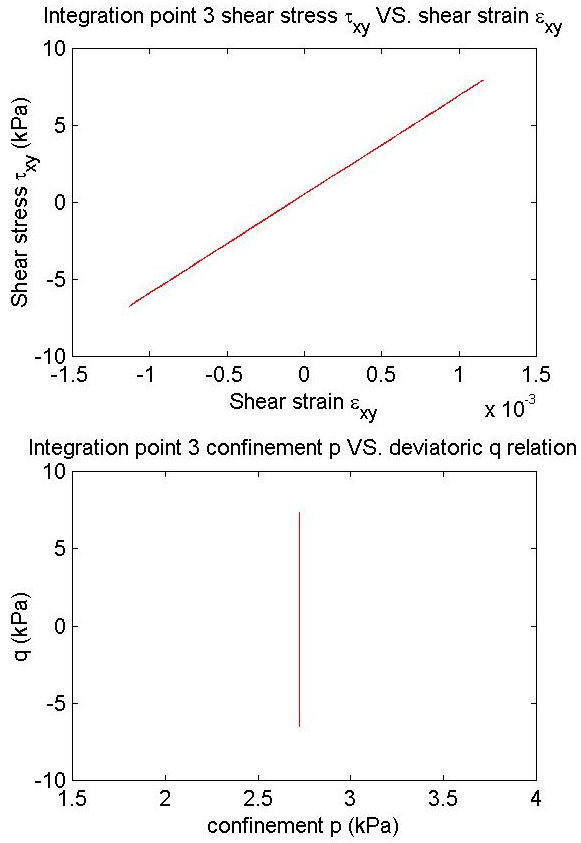
%integration point 3 p-q
po=(s5(:,2)+s5(:,3)+s5(:,4))/3;
for i=1:size(s5,1)
    qo(i)=(s5(i,2)-s5(i,3))^2 + (s5(i,3)-s5(i,4))^2 +(s5(i,2)-s5(i,4))^2 + 6.0* s5(i,5)^2;
    qo(i)=sign(s5(i,5))*1/3.0*qo(i)^0.5;
end

figure(4); clf;
%integration point 3 stress-strain
subplot(2,1,1), plot(e5(:,4),s5(:,5),'r');
title ('Integration point 3 shear stress \tau_x_y VS. shear strain \epsilon_x_y');
xLabel('Shear strain \epsilon_x_y');
yLabel('Shear stress \tau_x_y (kPa)');

subplot(2,1,2), plot(-po,qo,'r');
title ('Integration point 3 confinement p VS. deviatoric q relation');
xLabel('confinement p (kPa)');
yLabel('q (kPa)');
set(gcf,'paperposition',fs);
saveas(gcf,'SS_PQ5','jpg');

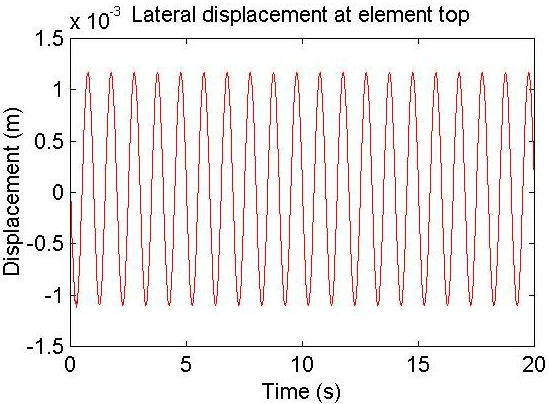
figure(2); clf;
%node 3 displacement relative to node 1
subplot(2,1,1),plot(d1(:,1),d1(:,6),'r');
title ('Lateral displacement at element top');
xLabel('Time (s)');
yLabel('Displacement (m)');
set(gcf,'paperposition',fs);
saveas(gcf,'D','jpg');


s=accMul*sin(0:pi/50:40*pi);
s1=interp1(0:0.01:20,s,a1(:,1));

figure(1); clf;
%node 3 relative acceleration
subplot(2,1,1),plot(a1(:,1),s1+a1(:,5),'r');
title ('Lateral acceleration at element top');
xLabel('Time (s)');
yLabel('Acceleration (m/s^2)');
set(gcf,'paperposition',fs);
saveas(gcf,'A','jpg');
MATLAB Plotting File
clear all;

a1=load('acce.out');
d1=load('disp.out');
s1=load('stress1.out');
e1=load('strain1.out');
s5=load('stress3.out');
e5=load('strain3.out');

fs=[0.5, 0.2, 4, 6];
accMul = 9.81;

%integration point 1 p-q
po=(s1(:,2)+s1(:,3)+s1(:,4))/3;
for i=1:size(s1,1)
    qo(i)=(s1(i,2)-s1(i,3))^2 + (s1(i,3)-s1(i,4))^2 +(s1(i,2)-s1(i,4))^2 + 6.0* s1(i,5)^2;
    qo(i)=sign(s1(i,5))*1/3.0*qo(i)^0.5;
end
figure(1); clf;
%integration point 1 stress-strain
subplot(2,1,1), plot(e1(:,4),s1(:,5),'r');
title ('Integration point 1 shear stress \tau_x_y VS. shear strain \epsilon_x_y');
xLabel('Shear strain \epsilon_x_y');
yLabel('Shear stress \tau_x_y (kPa)');

subplot(2,1,2), plot(-po,qo,'r');
title ('Integration point 1 confinement p VS. deviatoric q relation');
xLabel('confinement p (kPa)');
yLabel('q (kPa)');
set(gcf,'paperposition',fs);
saveas(gcf,'SS_PQ1','jpg');

%integration point 3 p-q
po=(s5(:,2)+s5(:,3)+s5(:,4))/3;
for i=1:size(s5,1)
    qo(i)=(s5(i,2)-s5(i,3))^2 + (s5(i,3)-s5(i,4))^2 +(s5(i,2)-s5(i,4))^2 + 6.0* s5(i,5)^2;
    qo(i)=sign(s5(i,5))*1/3.0*qo(i)^0.5;
end

figure(4); clf;
%integration point 3 stress-strain
subplot(2,1,1), plot(e5(:,4),s5(:,5),'r');
title ('Integration point 3 shear stress \tau_x_y VS. shear strain \epsilon_x_y');
xLabel('Shear strain \epsilon_x_y');
yLabel('Shear stress \tau_x_y (kPa)');

subplot(2,1,2), plot(-po,qo,'r');
title ('Integration point 3 confinement p VS. deviatoric q relation');
xLabel('confinement p (kPa)');
yLabel('q (kPa)');
set(gcf,'paperposition',fs);
saveas(gcf,'SS_PQ5','jpg');

figure(2); clf;
%node 3 displacement relative to node 1
subplot(2,1,1),plot(d1(:,1),d1(:,6),'r');
title ('Lateral displacement at element top');
xLabel('Time (s)');
yLabel('Displacement (m)');
set(gcf,'paperposition',fs);
saveas(gcf,'D','jpg');


s=accMul*sin(0:pi/50:40*pi);
s1=interp1(0:0.01:20,s,a1(:,1));

figure(1); clf;
%node 3 relative acceleration
subplot(2,1,1),plot(a1(:,1),s1+a1(:,5),'r');
title ('Lateral acceleration at element top');
xLabel('Time (s)');
yLabel('Acceleration (m/s^2)');
set(gcf,'paperposition',fs);
saveas(gcf,'A','jpg');
Displacement Output File
Stress-Strain Output File (Integration Point 1)
Stress-Strain Output File (Integration Point 3)
Acceleration Output File
Return to:
- NDMaterial Command
- UC San Diego soil models (Linear/Nonlinear, dry/drained/undrained soil response under general 2D/3D static/cyclic loading conditions (please visit UCSD for examples)
- UC San Diego Saturated Undrained soil
- Element Command
- UC San Diego u-p element (saturated soil)
- Related References


