Uploads by Mcganncr
Jump to navigation
Jump to search
This special page shows all uploaded files.
| Date | Name | Thumbnail | Size | Description | Versions |
|---|---|---|---|---|---|
| 22:08, 22 April 2010 | CtcTest.png (file) |  |
7 KB | Schematic of confined triaxial compression test for validation of Drucker-Prager constitutive model. | 2 |
| 22:46, 22 April 2010 | CtcResults.png (file) | 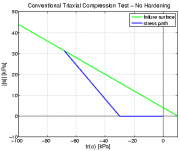 |
7 KB | Stress path for the confined triaxial compression test example analysis. | 1 |
| 20:51, 26 July 2010 | Schematic.ps (file) | 48 KB | schematic of BNWF model of laterall-loaded pile foundation | 1 | |
| 20:52, 26 July 2010 | FixComp.ps (file) | 46 KB | comparison of OpenSees and LPile results for free-head pile in BNWF model. | 1 | |
| 20:53, 26 July 2010 | FreeComp.ps (file) | 46 KB | comparison of OpenSees and LPile results for fixed-head pile in BNWF analysis. | 1 | |
| 20:53, 26 July 2010 | PyComp.ps (file) | 20 KB | comparison of p-y curves in OpenSees and LPile. | 1 | |
| 20:54, 26 July 2010 | Get pyParam.tcl (file) | 10 KB | procedure to define p-y curves for cohesionless soil. | 1 | |
| 20:55, 26 July 2010 | Get qzParam.tcl (file) | 2 KB | procedure to define Q-z springs for cohesionless soil | 1 | |
| 20:56, 26 July 2010 | Get tzParam.tcl (file) | 3 KB | procedure for defining t-z springs for cohesionless soil | 1 | |
| 20:56, 26 July 2010 | ElasticPileSection.tcl (file) | 401 bytes | 1 | ||
| 21:03, 26 July 2010 | Schematic.pdf (file) | 10 KB | schematic representation of BNWF model of laterall-loaded pile foundation | 1 | |
| 21:32, 26 July 2010 | PileSchematic.png (file) | 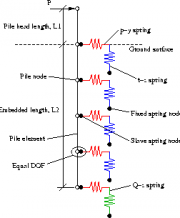 |
5 KB | Reverted to version as of 21:28, 26 July 2010 | 4 |
| 23:40, 26 July 2010 | TypicalPileResult.png (file) | 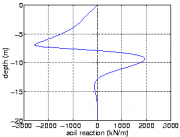 |
4 KB | 1 | |
| 00:01, 27 July 2010 | FixComp.png (file) | 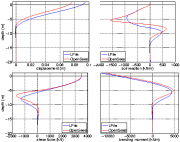 |
12 KB | 1 | |
| 00:01, 27 July 2010 | FreeComp.png (file) | 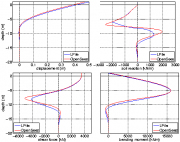 |
12 KB | 1 | |
| 00:02, 27 July 2010 | PyComp.png (file) | 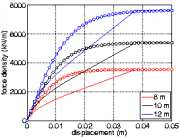 |
6 KB | 1 | |
| 00:03, 29 July 2010 | StaticBNWFanalysis.zip (file) | 9 KB | 1 | ||
| 01:12, 11 August 2010 | PileSchematic.gif (file) | 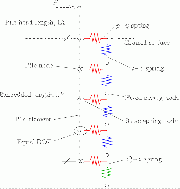 |
27 KB | 2 | |
| 01:19, 11 August 2010 | BnwfSchematic.png (file) | 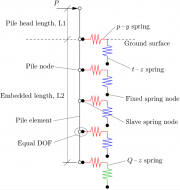 |
62 KB | 1 | |
| 21:20, 11 August 2010 | SiteRespModel.png (file) | 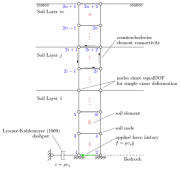 |
44 KB | 2 | |
| 21:28, 11 August 2010 | FreeFieldDamp.tcl (file) | 12 KB | Site response analysis file for layered soil column with Lysmer-Kuhlemeyer dashpot for consideration of finite rigidity of the underlying medium. | 1 | |
| 22:53, 11 August 2010 | SiteResponseTotal.zip (file) | 42 KB | 2 | ||
| 23:00, 11 August 2010 | SurfaceAccel.png (file) | 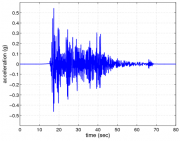 |
45 KB | recorded acceleration time history at the ground surface for site response example | 1 |
| 23:02, 11 August 2010 | SurfaceSpectra.png (file) | 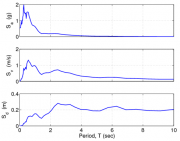 |
31 KB | Acceleration, velocity, and displacement response spectra for the ground surface of the site response model. | 1 |
| 23:05, 11 August 2010 | DepthSummary.png (file) | 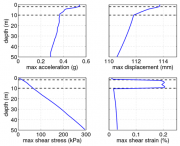 |
48 KB | 1 | |
| 23:12, 16 August 2010 | ConsolModel.png (file) | 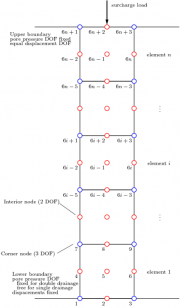 |
48 KB | schematic of 1D consolidation model | 1 |
| 23:14, 16 August 2010 | 9ndConnect.png (file) |  |
13 KB | connectivity diagram for 9_4_QuadUP element | 1 |
| 23:16, 16 August 2010 | StressDD.png (file) | 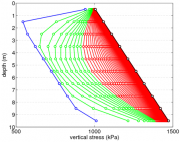 |
82 KB | 1 | |
| 23:10, 17 September 2010 | SurfAccelSingle.png (file) | 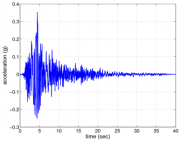 |
31 KB | 1 | |
| 23:11, 17 September 2010 | LogSpectraSingle.png (file) | 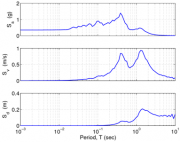 |
38 KB | response spectra at ground surface for example file freeFieldSingle.tcl | 1 |
| 23:12, 17 September 2010 | LogSpectraDepend.png (file) | 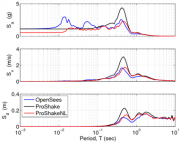 |
45 KB | response spectra at ground surface for comparison study example using file freeFieldDepend.tcl | 1 |
| 23:12, 17 September 2010 | LogSpectraIndepend.png (file) | 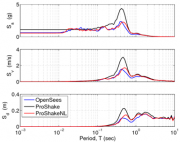 |
47 KB | response spectra at ground surface for comparison study example using file freeFieldIndepend.tcl | 1 |
| 23:13, 17 September 2010 | SurfAccelDepend.png (file) | 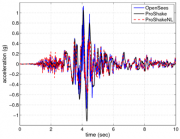 |
56 KB | recorded acceleration response at ground surface for comparison study example using file freeFieldDepend.tcl | 1 |
| 23:13, 17 September 2010 | SurfAccelIndepend.png (file) | 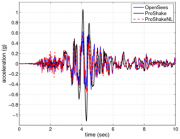 |
59 KB | recorded acceleration response at ground surface for comparison study example using file freeFieldIndepend.tcl | 1 |
| 23:14, 17 September 2010 | SiteResponseAnalysis.zip (file) | 93 KB | files for site response analysis example | 1 | |
| 23:14, 17 September 2010 | FreeFieldDepend.tcl (file) | 16 KB | OpenSees input file used for comparison site response analysis study | 1 | |
| 23:15, 17 September 2010 | FreeFieldIndepend.tcl (file) | 16 KB | OpenSees input file used for comparison site response analysis study | 1 | |
| 23:15, 17 September 2010 | FreeFieldSingle.tcl (file) | 12 KB | example site response analysis OpenSees input file | 1 | |
| 23:56, 30 September 2010 | EffDepthSummary.png (file) | 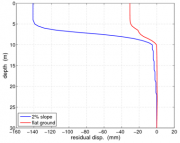 |
23 KB | plot of residual displacement vs. depth for flat and sloped effective stress site response analyses | 1 |
| 23:57, 30 September 2010 | FlatSummary.png (file) | 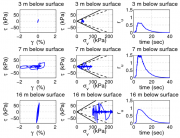 |
104 KB | stress, strain, excess pore pressure summary plot for eff stress site response analysis example | 1 |
| 00:21, 5 October 2010 | FlatAnimation.gif (file) | 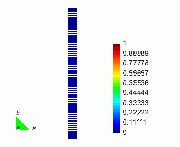 |
1.76 MB | 2 | |
| 00:28, 5 October 2010 | SlopeSummaryNew.png (file) | 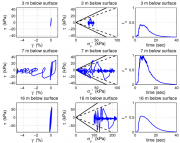 |
103 KB | 1 | |
| 00:29, 5 October 2010 | FlatSummaryNew.png (file) | 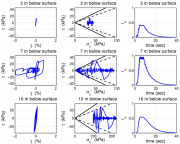 |
102 KB | 1 | |
| 00:29, 5 October 2010 | SlopeSummary.png (file) | 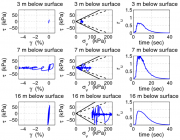 |
103 KB | Reverted to version as of 23:58, 30 September 2010 | 4 |
| 01:06, 5 October 2010 | EffStressSiteModel.png (file) | 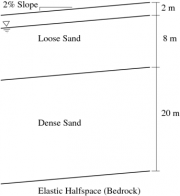 |
19 KB | schematic depicting the soil profile modeled using the sloped example contained in the the effective stress site response article | 1 |
| 17:59, 5 October 2010 | NineNodeElem.png (file) | 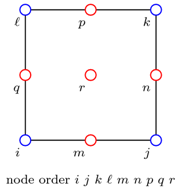 |
7 KB | representation of nine node quad element connectivity | 1 |
| 20:32, 22 October 2010 | SlopeDispComp.png (file) | 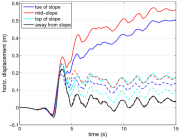 |
48 KB | comparison of displacement histories at several points for 2D slope analyses where one case liquefies and the other does not liquefy. | 1 |
| 18:37, 26 October 2010 | SlopePPcomp2.png (file) | 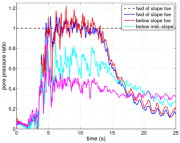 |
80 KB | 1 | |
| 19:29, 26 October 2010 | SlopeAnalysis2Deff.zip (file) | 149 KB | updated files for example | 4 | |
| 20:17, 26 October 2010 | SlopeAnalysis2Deff.tcl (file) | 568 KB | 2 |